Digital Transformation of Farmers Almanac
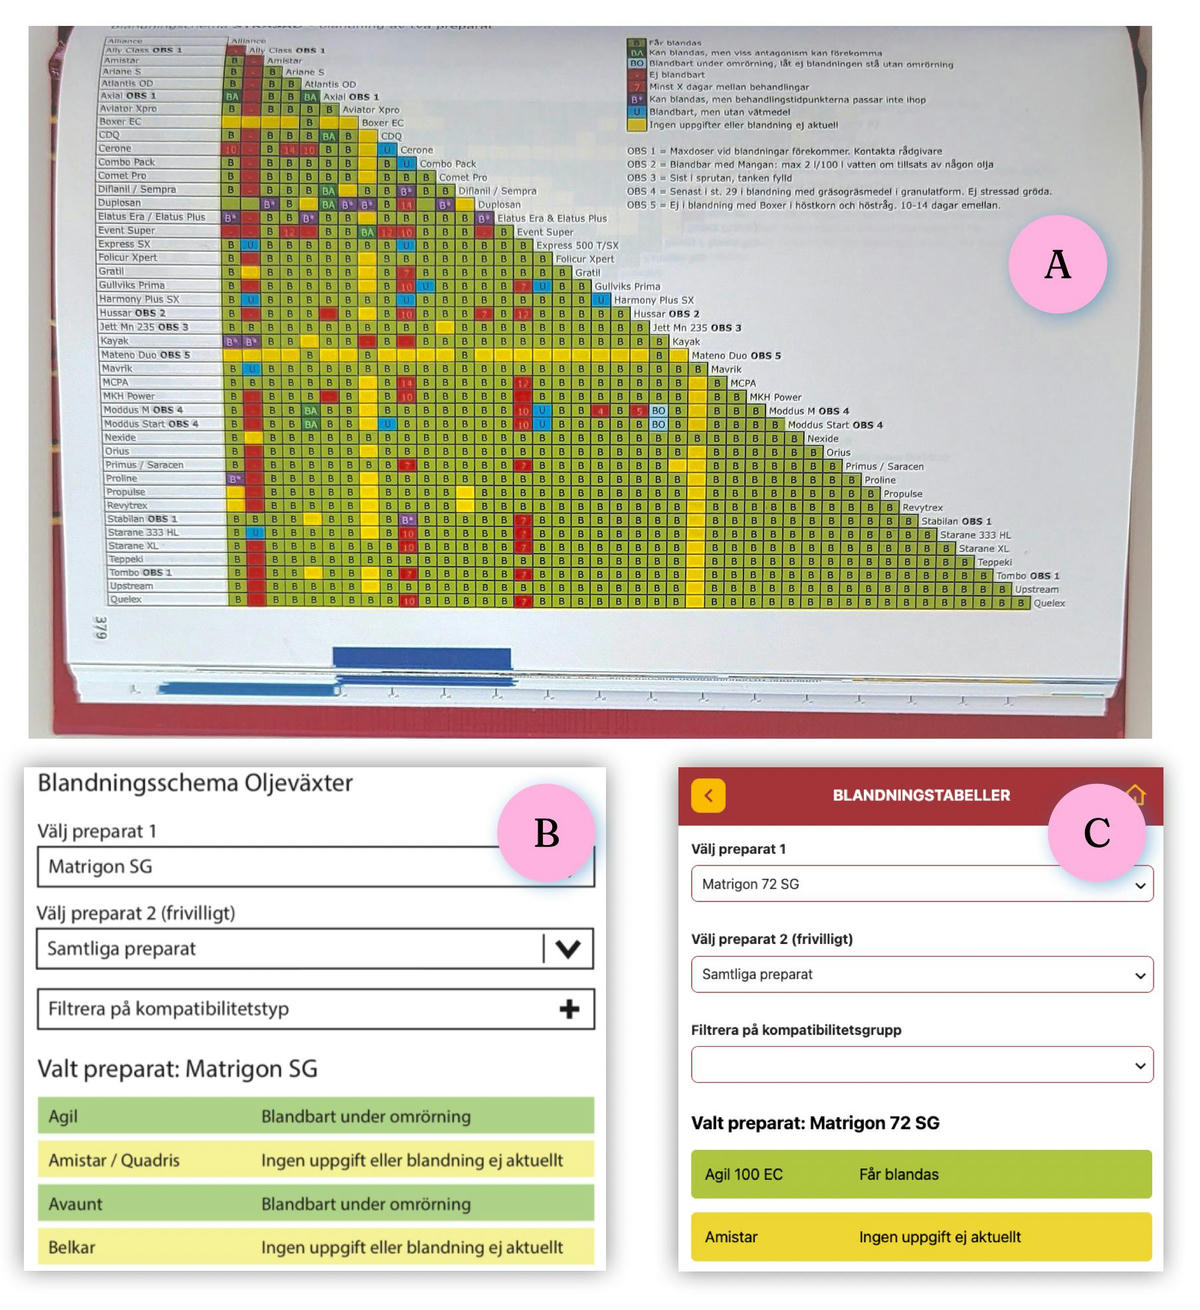
For decades, farmers have turned to Gullviks for expert advice on maximizing their crop yields. Gullviks offers expertise and products for fertilization, crop protection, and more. Once a year, they also distribute the Gullviks Farmers Almanac to their customers—a publication full of tables that help farmers quickly find solutions for handling issues like cornflower or field pansy in their winter wheat.
The Challenge The crop protection industry evolves as quickly as any other, with regulatory bodies frequently updating safety thresholds and usage guidelines for various products. This meant that the printed handbook often became outdated before the year’s end. Gullviks decided it was time to digitize the book, motivated by several key reasons:
- Outdated content – Regulations and usage guidelines can change throughout the year.
- Scattered knowledge – Information was spread across Word docs and spreadsheets, making it hard to keep track of the latest version.
- Cost – Printing and shipping physical copies involved significant expense.
- Environmental impact – Paper, ink, and shipping contribute to carbon emissions.
- Limited space – Physical books had to be pocket-sized, which sometimes made tables hard to read.
The Solution: Going Digital As a digital agency, it was no surprise that our solution involved a digital transformation. Gullviks had already concluded that an online version of the handbook would offer multiple advantages:
- Real-time updates – The online version ensures information is always current.
- Single source of truth – We developed a custom admin system, consolidating content previously scattered across different formats.
- Reduced costs – No need to print and ship thousands of copies.
- Better product – Even at launch, the digital Gullviks Farmers Almanac offered improvements over the print version. Since then, we've continued to develop features that would be impossible in print.
Process
We follow a three-step process when conducting pre-studies for projects like this. It helps provide a clear direction early on and determines whether it’s a worthwhile investment. You can apply this method to your own studies by following these steps:
Can we do this?
We identify the most difficult challenges and solve them using an MVP (Minimum Viable Product). In this case, the big question was whether we could present crop protection strategies and mixing tables more clearly than in print. We also focused on designing a usable admin interface.
Admin interfaces are often overlooked because businesses naturally prioritize the customer-facing side. But if the solution requires frequent updates, you must put just as much care into how information is entered as into how it’s displayed.
Given how specific the data was, we didn’t use an off-the-shelf CMS. Instead, we built a custom system for entering and managing all the information. Today, Gullviks owns the world's best system for crop protection data—fully owned by them and free of licensing fees.
Since the challenges here were primarily about UI, wireframes were enough to test the ideas—no code needed.

What value does this add?
Just because something is possible doesn’t mean it’s worth doing. This step is about questioning the project’s purpose. Are we adding anything new? If others are already doing it, why should we do it too?
Sometimes the value lies in bringing tools together, improving accessibility, or reducing costs. But if the only answer is "It’ll look nice," it’s probably not worth investing in.
The digital Gullviks Farmers Almanac adds real value in several ways—some of which we can’t even talk about publicly yet.
Prioritize and organize Once you know what’s needed, success depends on doing things in the right order. Obvious things come first—no one starts with the roof before laying the foundation—but prioritizing features isn’t always so clear-cut.
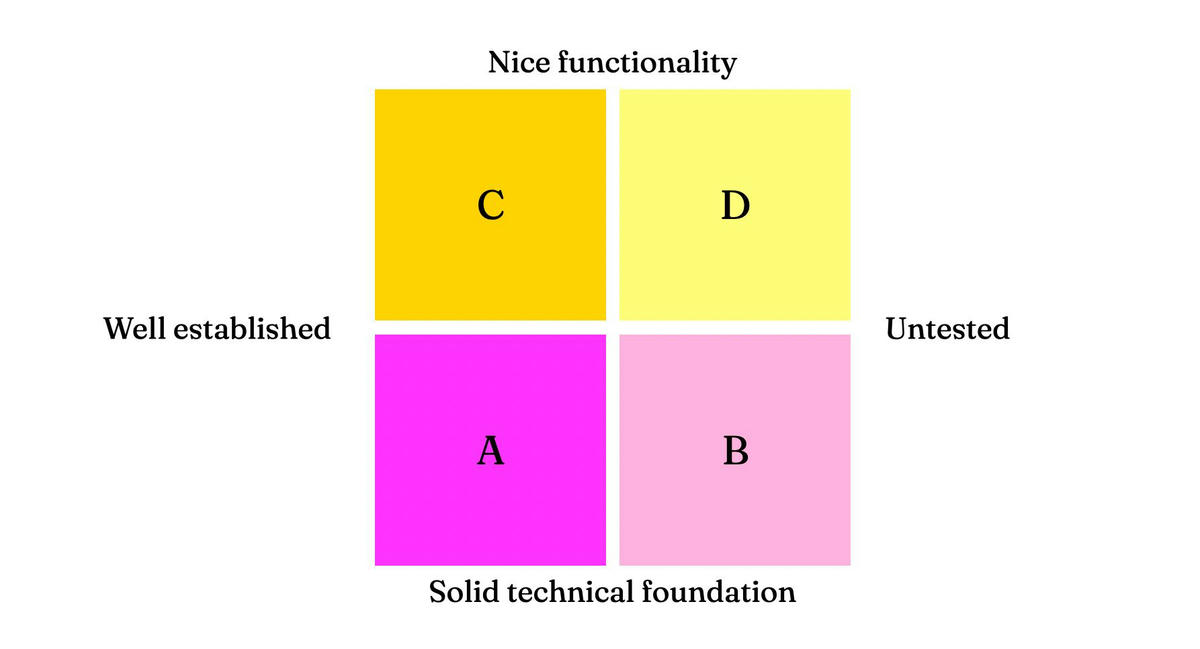
We sorted features using a four-quadrant model with one axis being if the technology was well established or untested, and the other if the feature was must have for the foundation or some brand new solution.

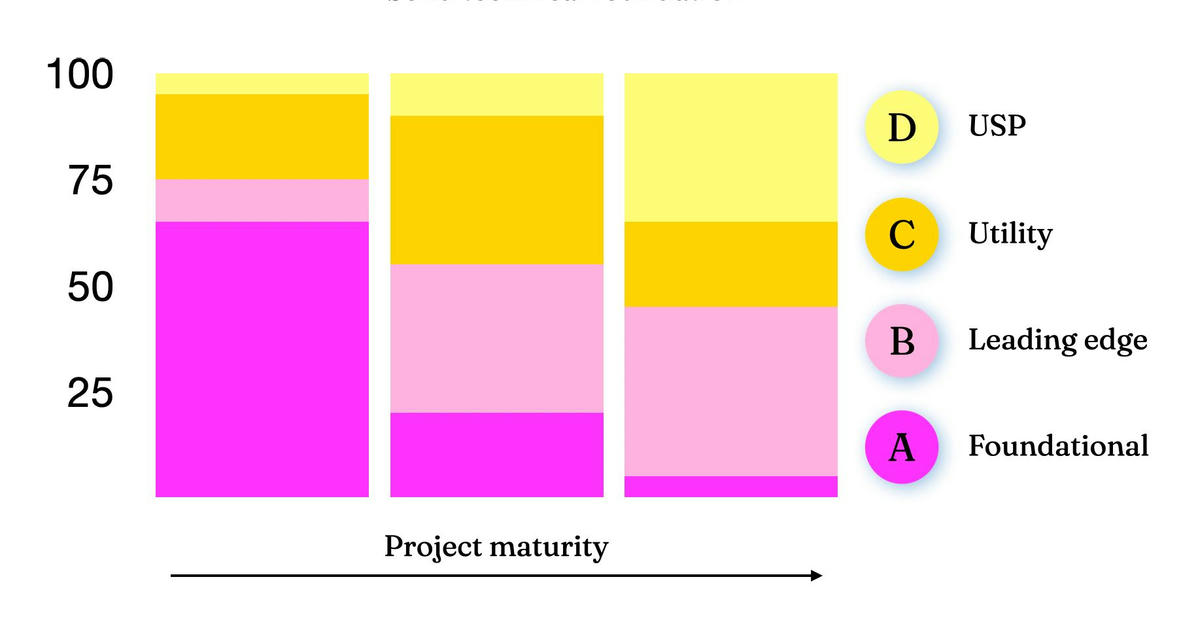
A) Foundational
B) Leading edge
C) Utilities
D) Unique Selling Propositions (USPs)
A good mix from each category is essential, but features from quadrant A (Foundational) should be implemented before tackling C or D. D might contain what gives the project its edge, but A ensures stability.

Roadmap Step one was building a custom admin interface for inputting crop protection strategies. At the time, this data existed only in flat text. We structured it into distinct fields to allow future cross-referencing of crops, products, and targets.
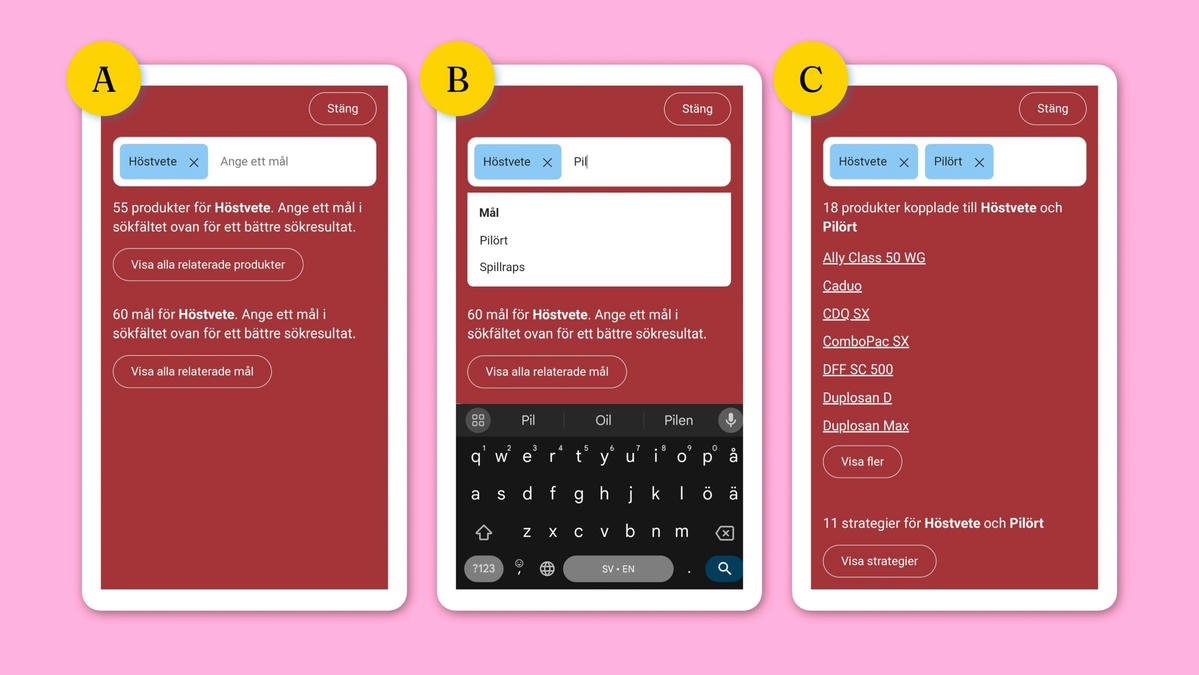
We then built the structure for entering and storing data related to crops (oats, strawberries, rapeseed, etc.), targets (pests, weeds, growth regulation, etc.), and products. Next, we added advanced info like compatibility between products and a robust free-text search.
The search feature was only possible after completing multiple foundational steps: building a normalized database, enabling data input through the admin interface, and developing a user interface to display results.

Beyond Digitization People still debate the difference between digitization and digital transformation, but here the line is clear. The early features we built replicated the paper handbook; the new ones go beyond what was ever possible in print.
Soon, we’ll be launching a new tool that uses historical weather data and GPS to provide tailored recommendations. This and upcoming features—using APIs and mobile sensors—represent a true digital transformation for farmers.
The Gullviks Farmers Almanac has evolved from a printed calendar with extra info to a powerful digital transformation tool for agriculture.